DataCraftR is an R package that provides a set of
interactive tools for data generation through
visualization.
Each tool is implemented as a Shiny addin integrating
D3.js for real-time, graphical data creation.
Developed with: Human Coding Inspried on: drawdata.xyz Powered by: Shiny and D3
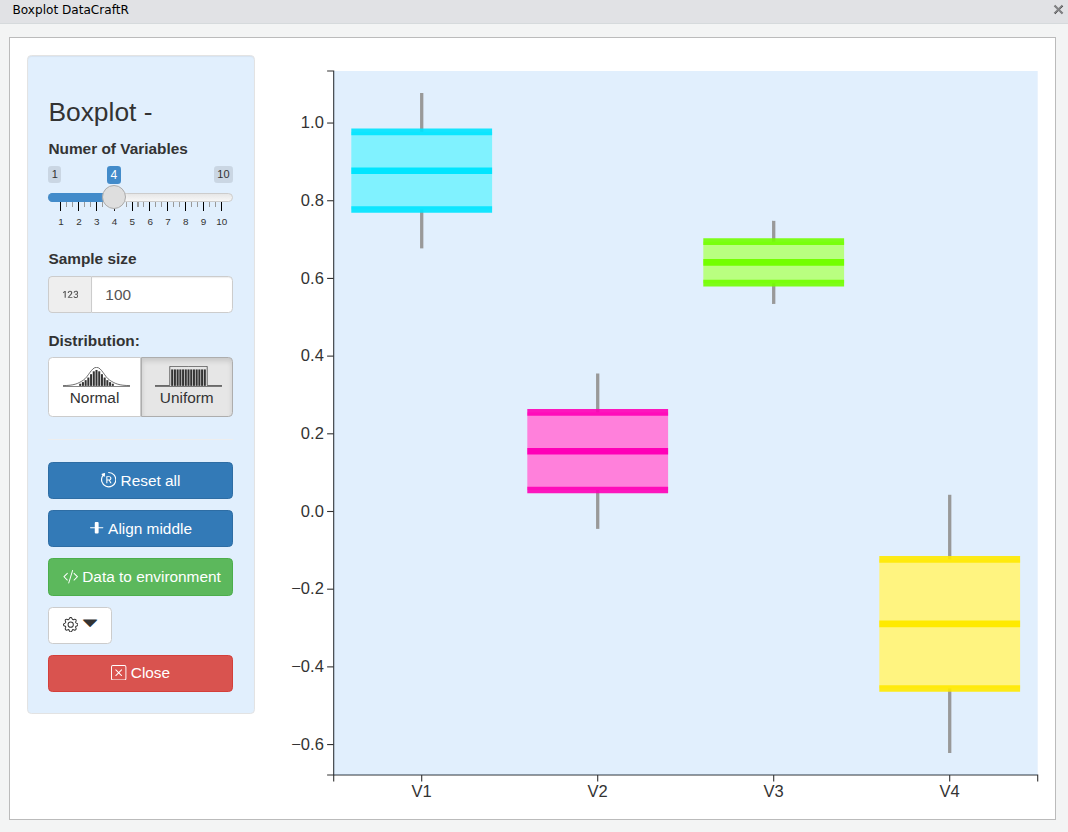
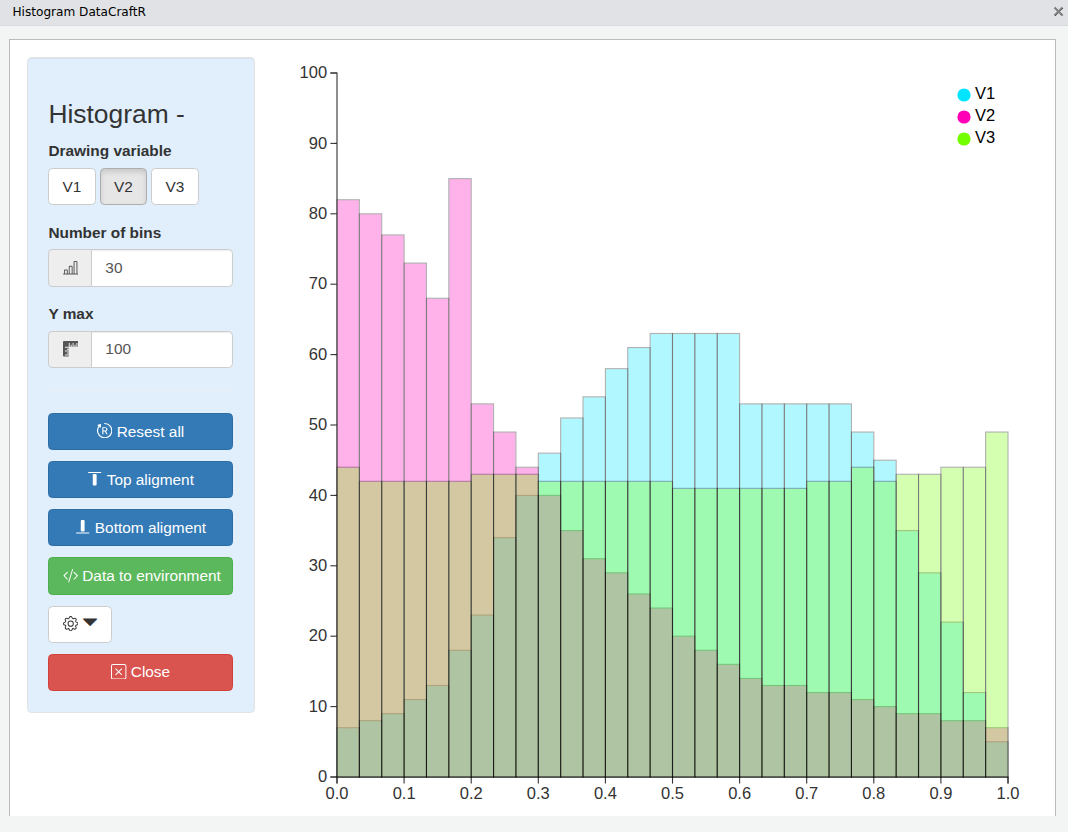
DataCraftR allows users to draw or manipulate visual representations of data (boxplots, histograms, scatterplots) and automatically generate the corresponding datasets in R.
This package is ideal for teaching, demonstrations, or prototyping datasets based on distributional intuition.
# From GitHub
# (requires the 'remotes' package)
install.packages("remotes")
remotes::install_github("CarlosRivera1212/DataCraftR")Each visualization tool can be launched directly from R or from the RStudio Addins menu.
# Boxplot generator
DataCraftR::boxplot_dcr()

# Histogram generator
DataCraftR::histogram_dcr()

# Scatter plot generator
DataCraftR::scatter_dcr()
Each tool opens a Shiny gadget with an interactive D3.js
visualization.
The generated data can be exported to temporal RDS file by clicking
“Save Data”.
inst/assets/js/
and are loaded dynamically by each addin.sendCustomMessage and input bindings.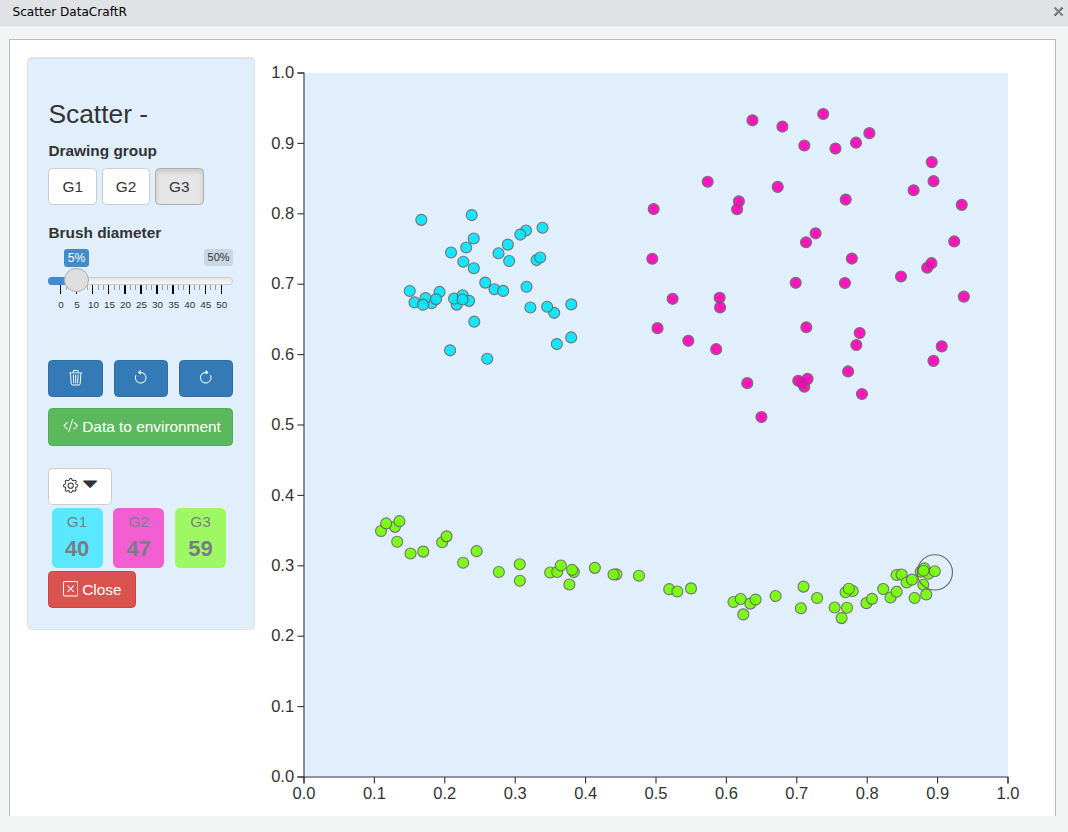
Carlos Rivera
This package is licensed under the GPL-3.0 License.
See the LICENSE file for more details.
If you use this package in academic work, please cite it as:
Rivera, C. (2025). DataCraftR: Interactive Data Generation Tools with Shiny and D3.js. GitHub repository: https://github.com/CarlosRivera1212/DataCraftR