![]()
![]()
![]()
A lightweight extension of the base R graphics system, with support for automatic grouping, legends, facets, themes, and various other enhancements.
The stable version of tinyplot is available on CRAN.
install.packages("tinyplot")Or, you can grab the latest development version from R-universe.
install.packages("tinyplot", repos = "https://grantmcdermott.r-universe.dev")R users are spoiled for choice when it comes to visualization frameworks. The options, of course, include ggplot2 and lattice; say nothing of the bewildering array of extensions built around, on top of, and in between these amazing packages.1
Given the wealth of options, it is perhaps understandable that even
avid R users can overlook the base R graphics system.
This is unfortunate, because base R offers very powerful and flexible
plotting facilities.2 The downside of this power and
flexibility is that base R plotting can require a lot of manual
tinkering. A case in point is plotting grouped data with an appropriate
legend. Doing so with the generic plot() function can
require several function calls or a loop, fiddling with your plot
regions, and then generating the legend manually.
The tinyplot package aims to remove this overhead.
It provides a lightweight extension of the base R graphics system that
preserves the same core logic and syntax, but with numerous convenience
features to make base R plotting a more user-friendly experience. For
example, the core tinyplot() function—or its shorthand
alias plt()—makes it easy to plot grouped datasets and
generate automatic legends in a single function call. Or, you can
display groups in separate facets without having to worry about manually
setting plot regions. While tinyplot offers these and
various other enhancements, it tries as far as possible to be a drop-in
replacement for the equivalent base plotting function. Users should
generally be able to swap out a valid plot() call for
tinyplot()/plt() without any changes to the
expected output.
It is worth emphasizing that tinyplot requires only base R. It has zero recursive dependencies and we have been careful to keep its installation size down to a minimum. tinyplot should thus provide an attractive and lightweight option for package developers (or regular R users!) who would like to produce convenient and sophisticated plots, combined with a minimal footprint.
The tinyplot website includes a detailed introductory tutorial, with numerous examples. But here are some quickstart examples of the package in action.
library(tinyplot)Grouped scatterplot with automatic legend:
# with(iris, tinyplot(x = Petal.Length, y = Sepal.Length, by = Species)) # atomic
tinyplot(Sepal.Length ~ Petal.Length | Species, data = iris)             # formula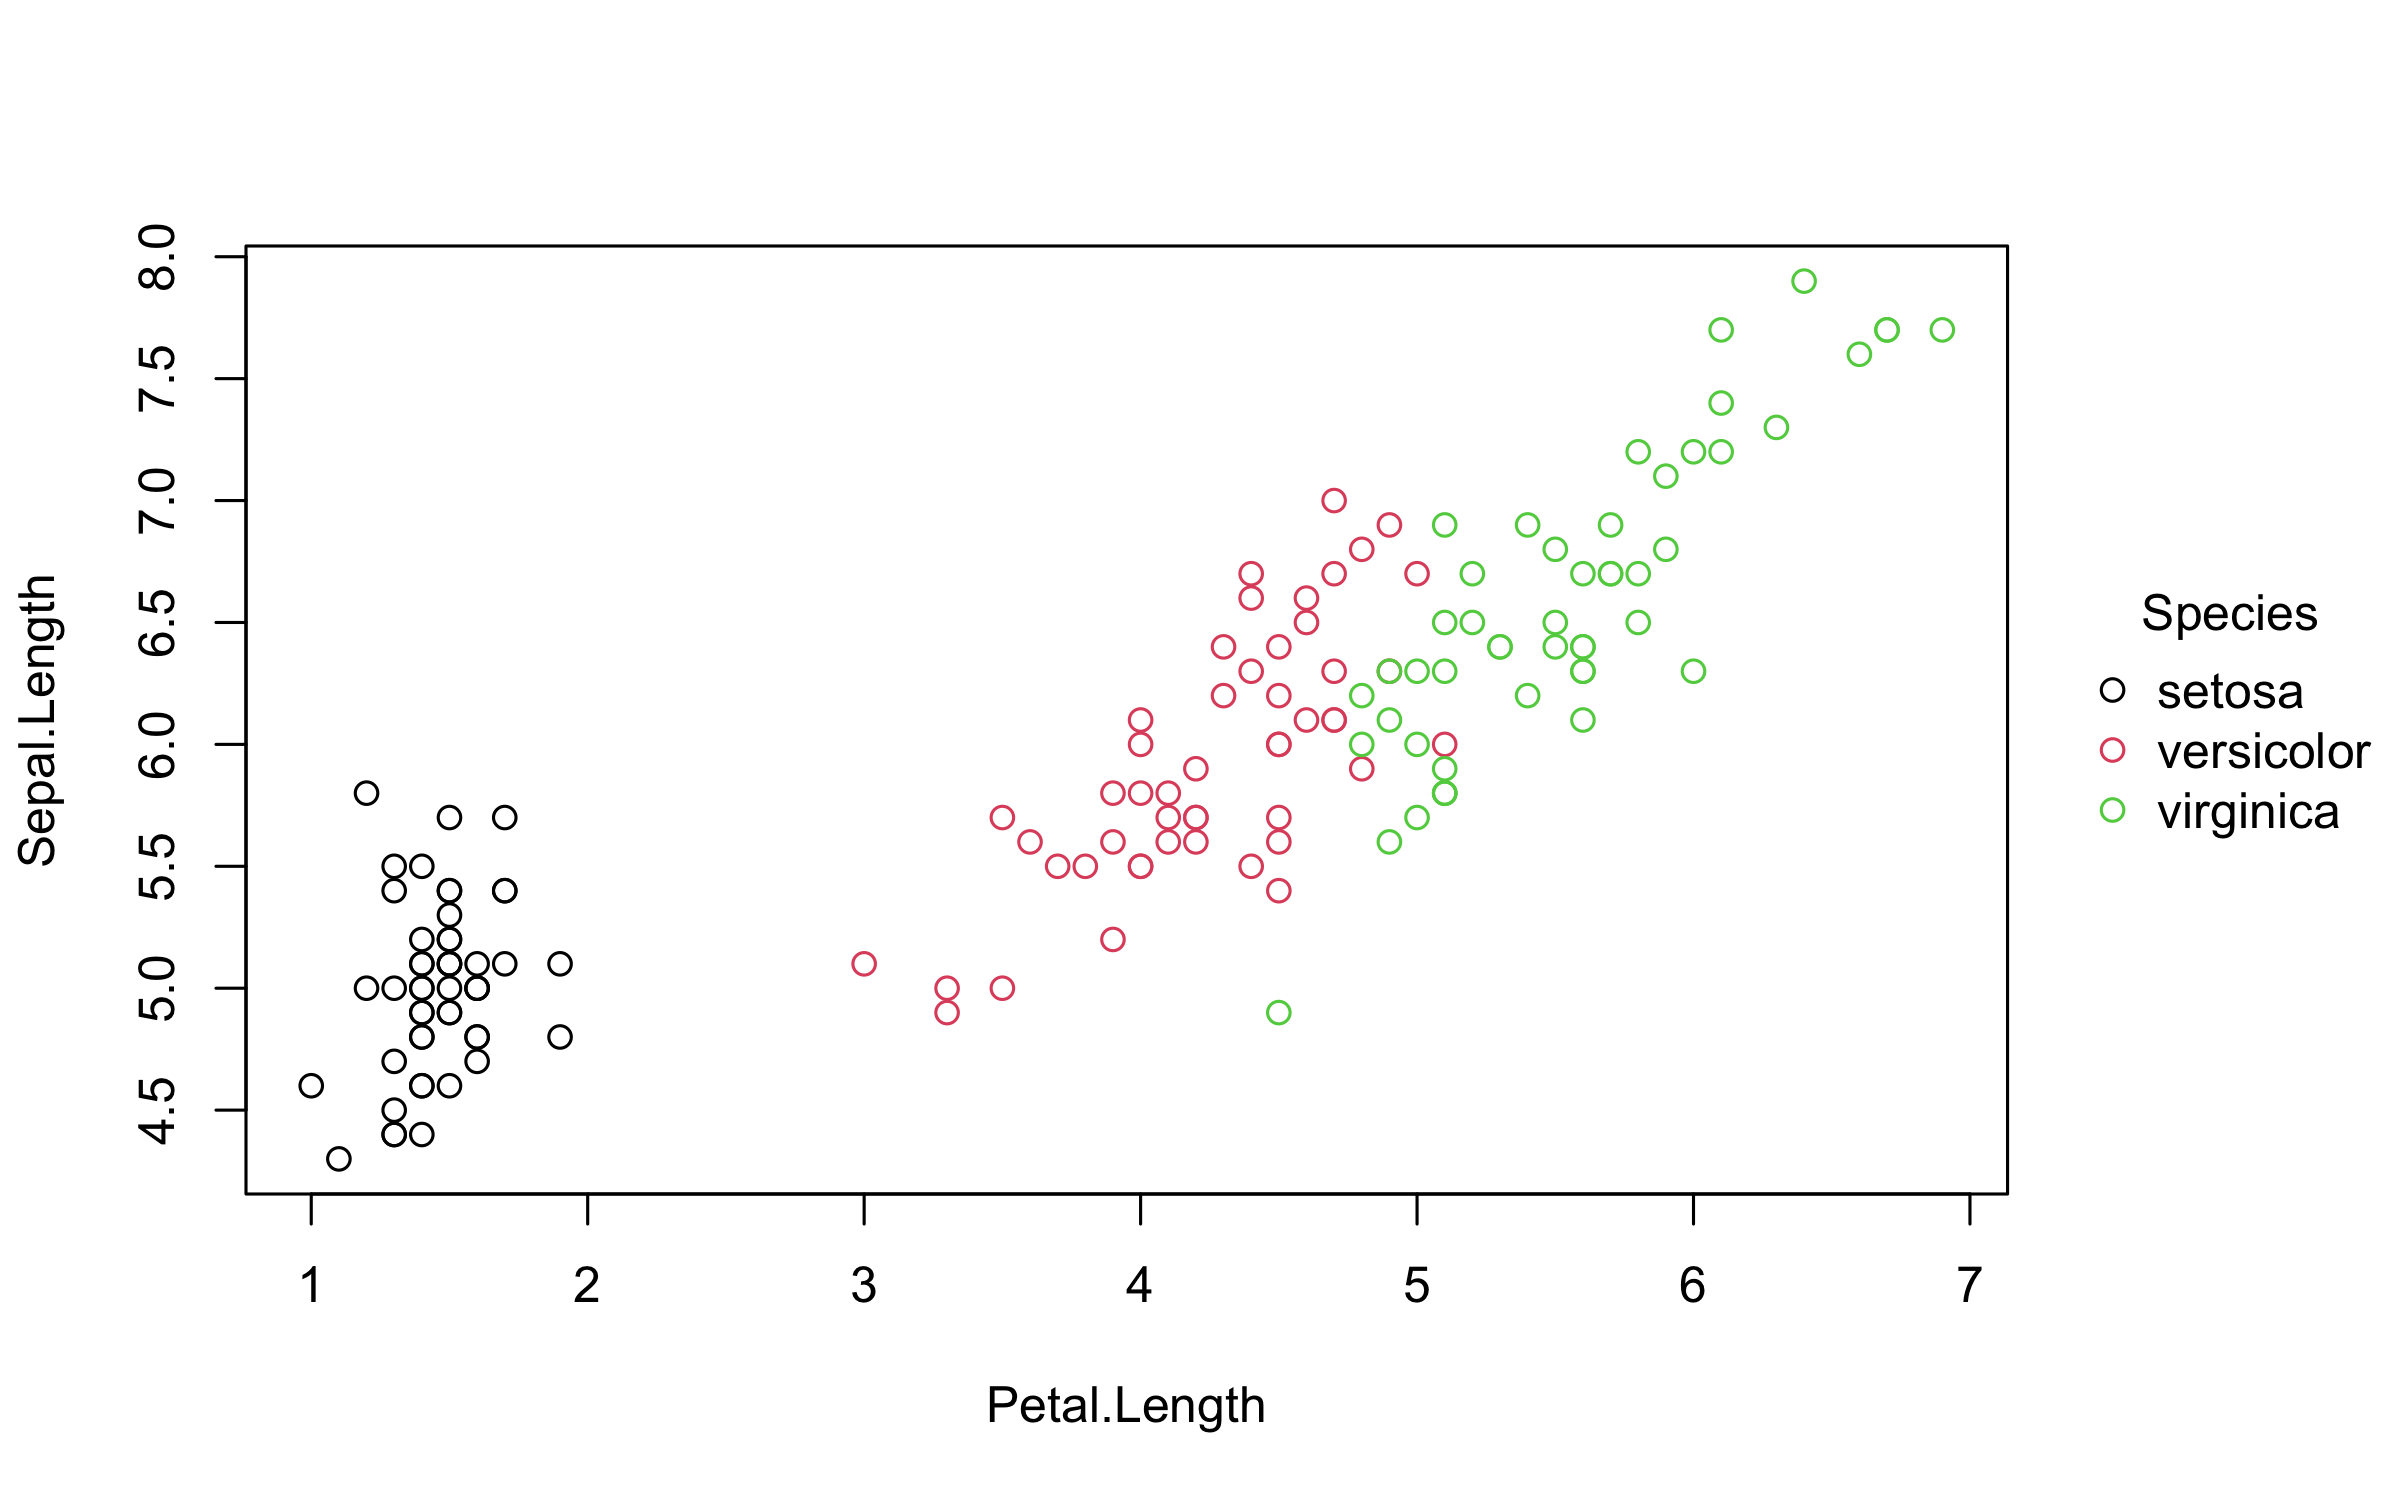
If you would prefer to save on a few keystrokes, you can use the
shorthand plt() alias instead of typing out
tinyplot() in full. Here’s the same plot with this
shorthand plt() alias, as well as an added
"lm" layer and a few aesthetic tweaks:
plt(
  Sepal.Length ~ Petal.Length | Species,
  data = iris,
  palette = "dark", pch = 16,
  grid = TRUE, frame = FALSE
)
plt_add(type = "lm")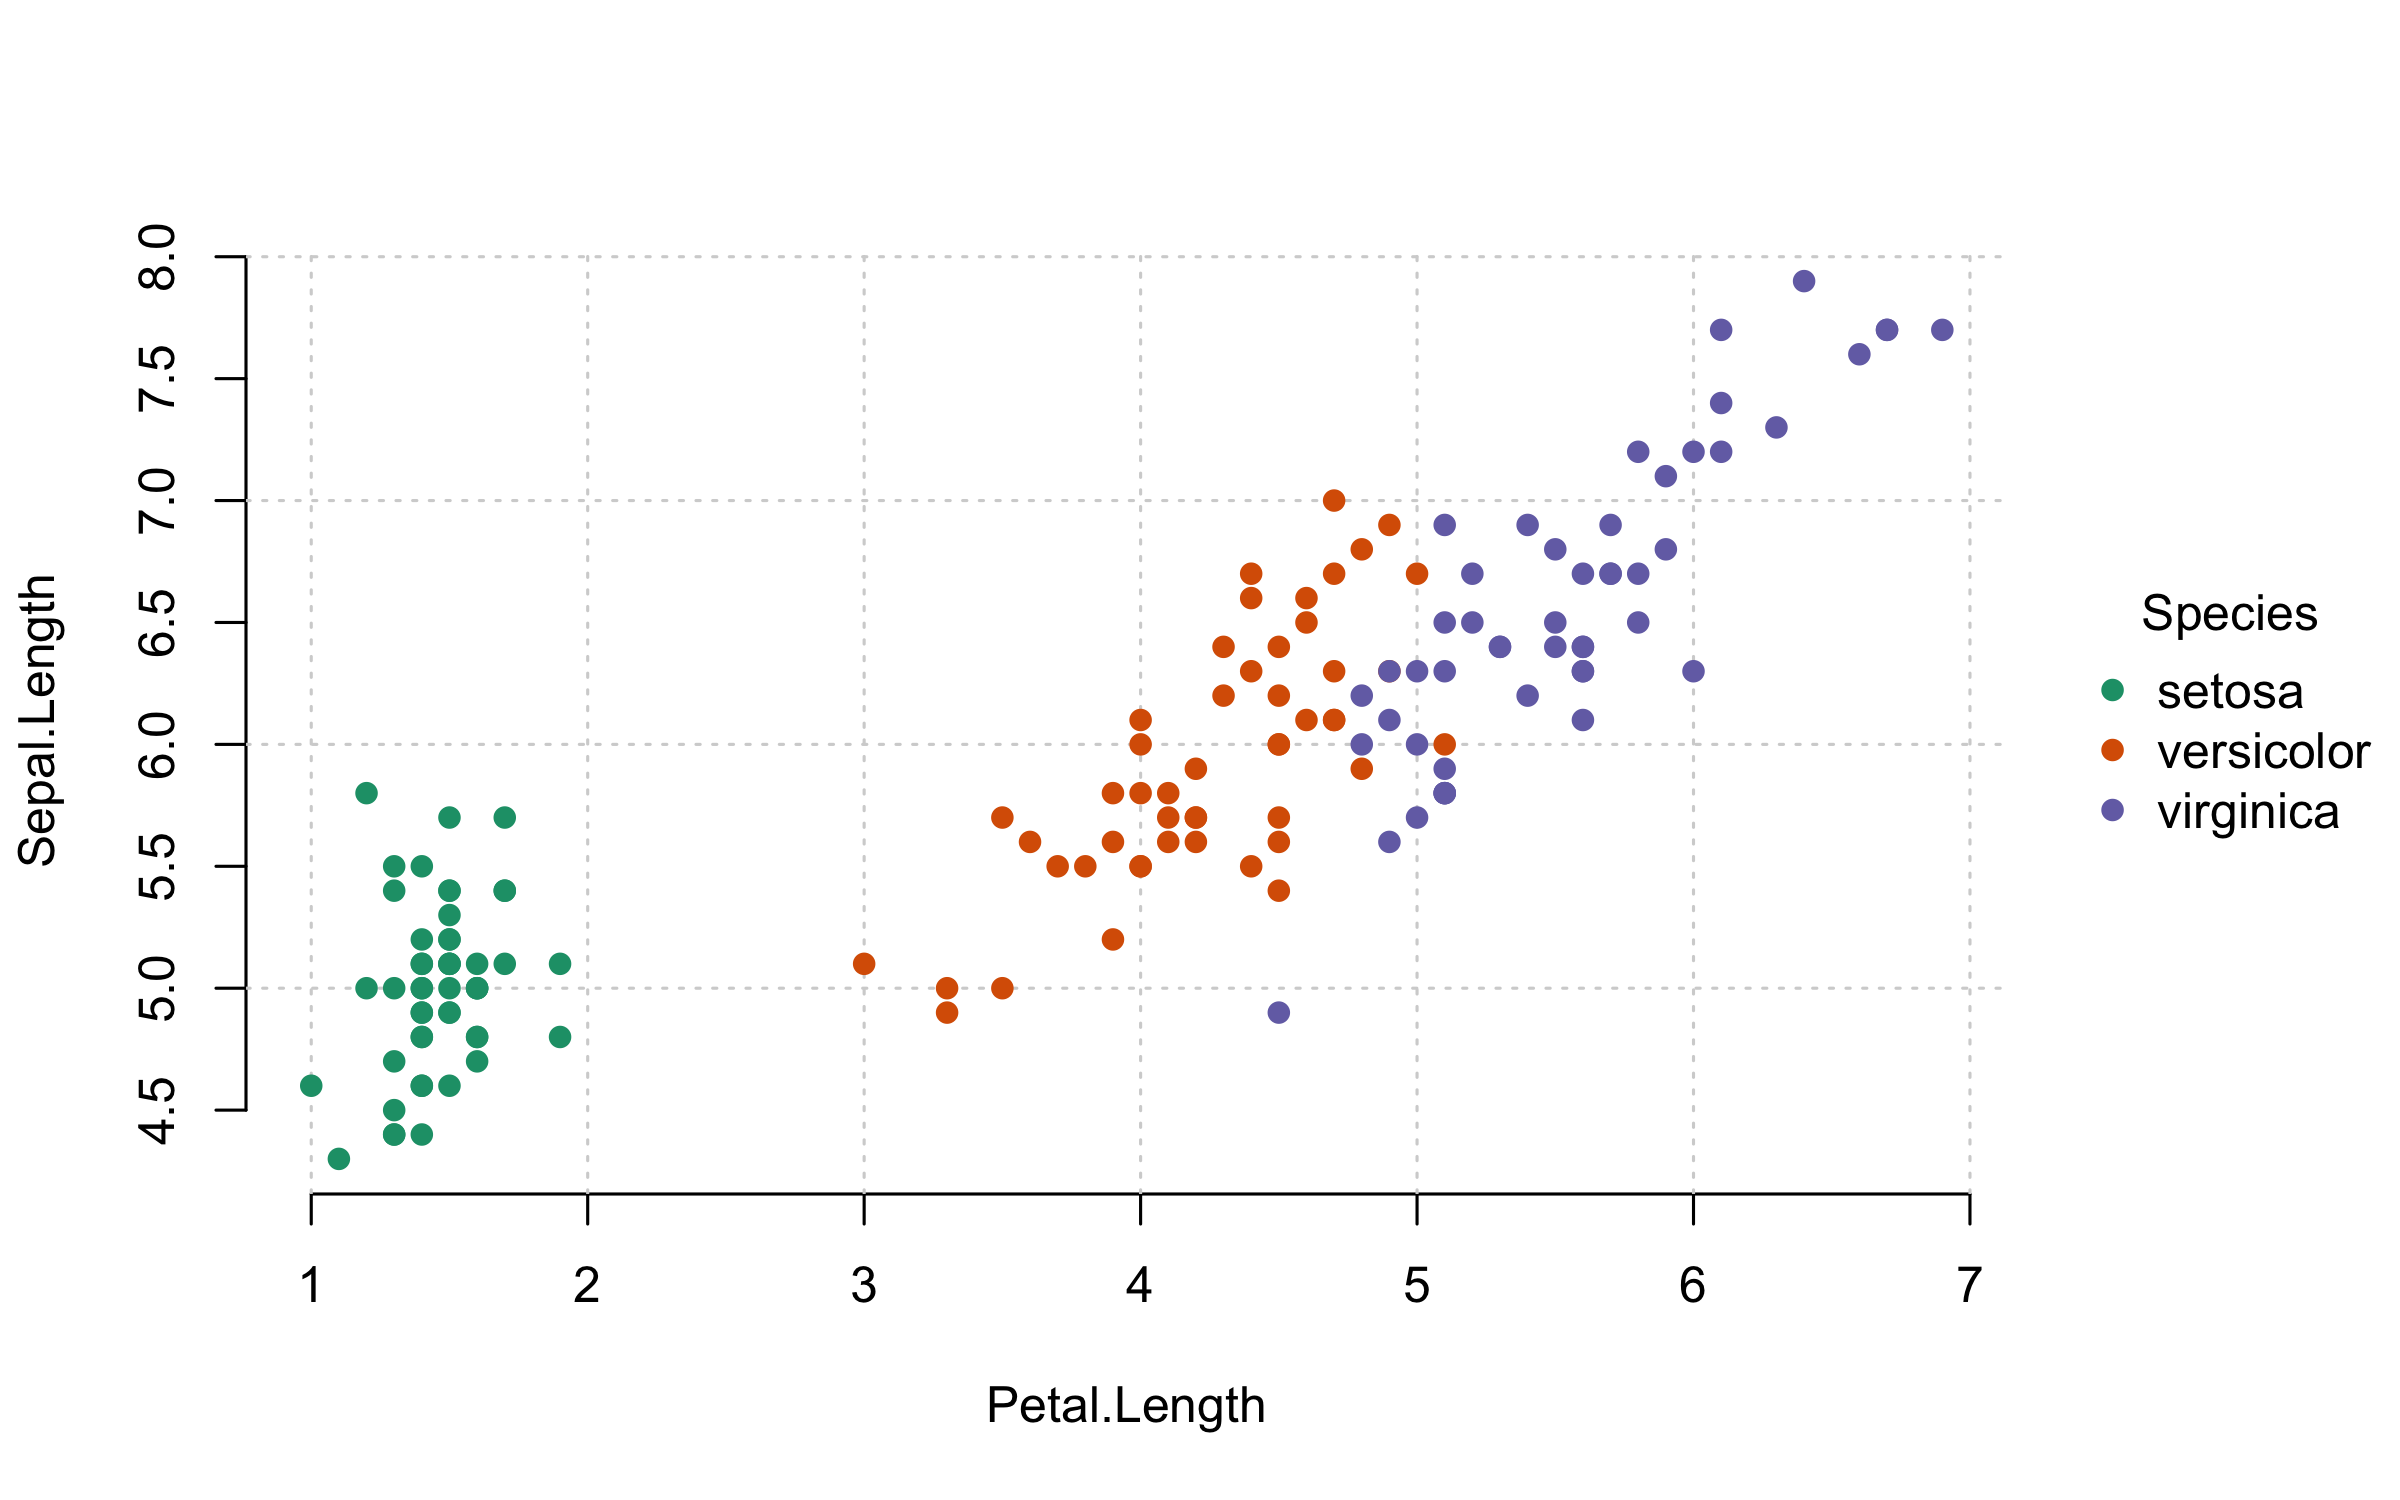
Speaking of aesthetic tweaks, tinyplot also provides a set of built-in themes for convenient plot customization:
tinytheme("clean2")

plt(Sepal.Length ~ Petal.Length | Species, data = iris)
plt_add(type = "lm")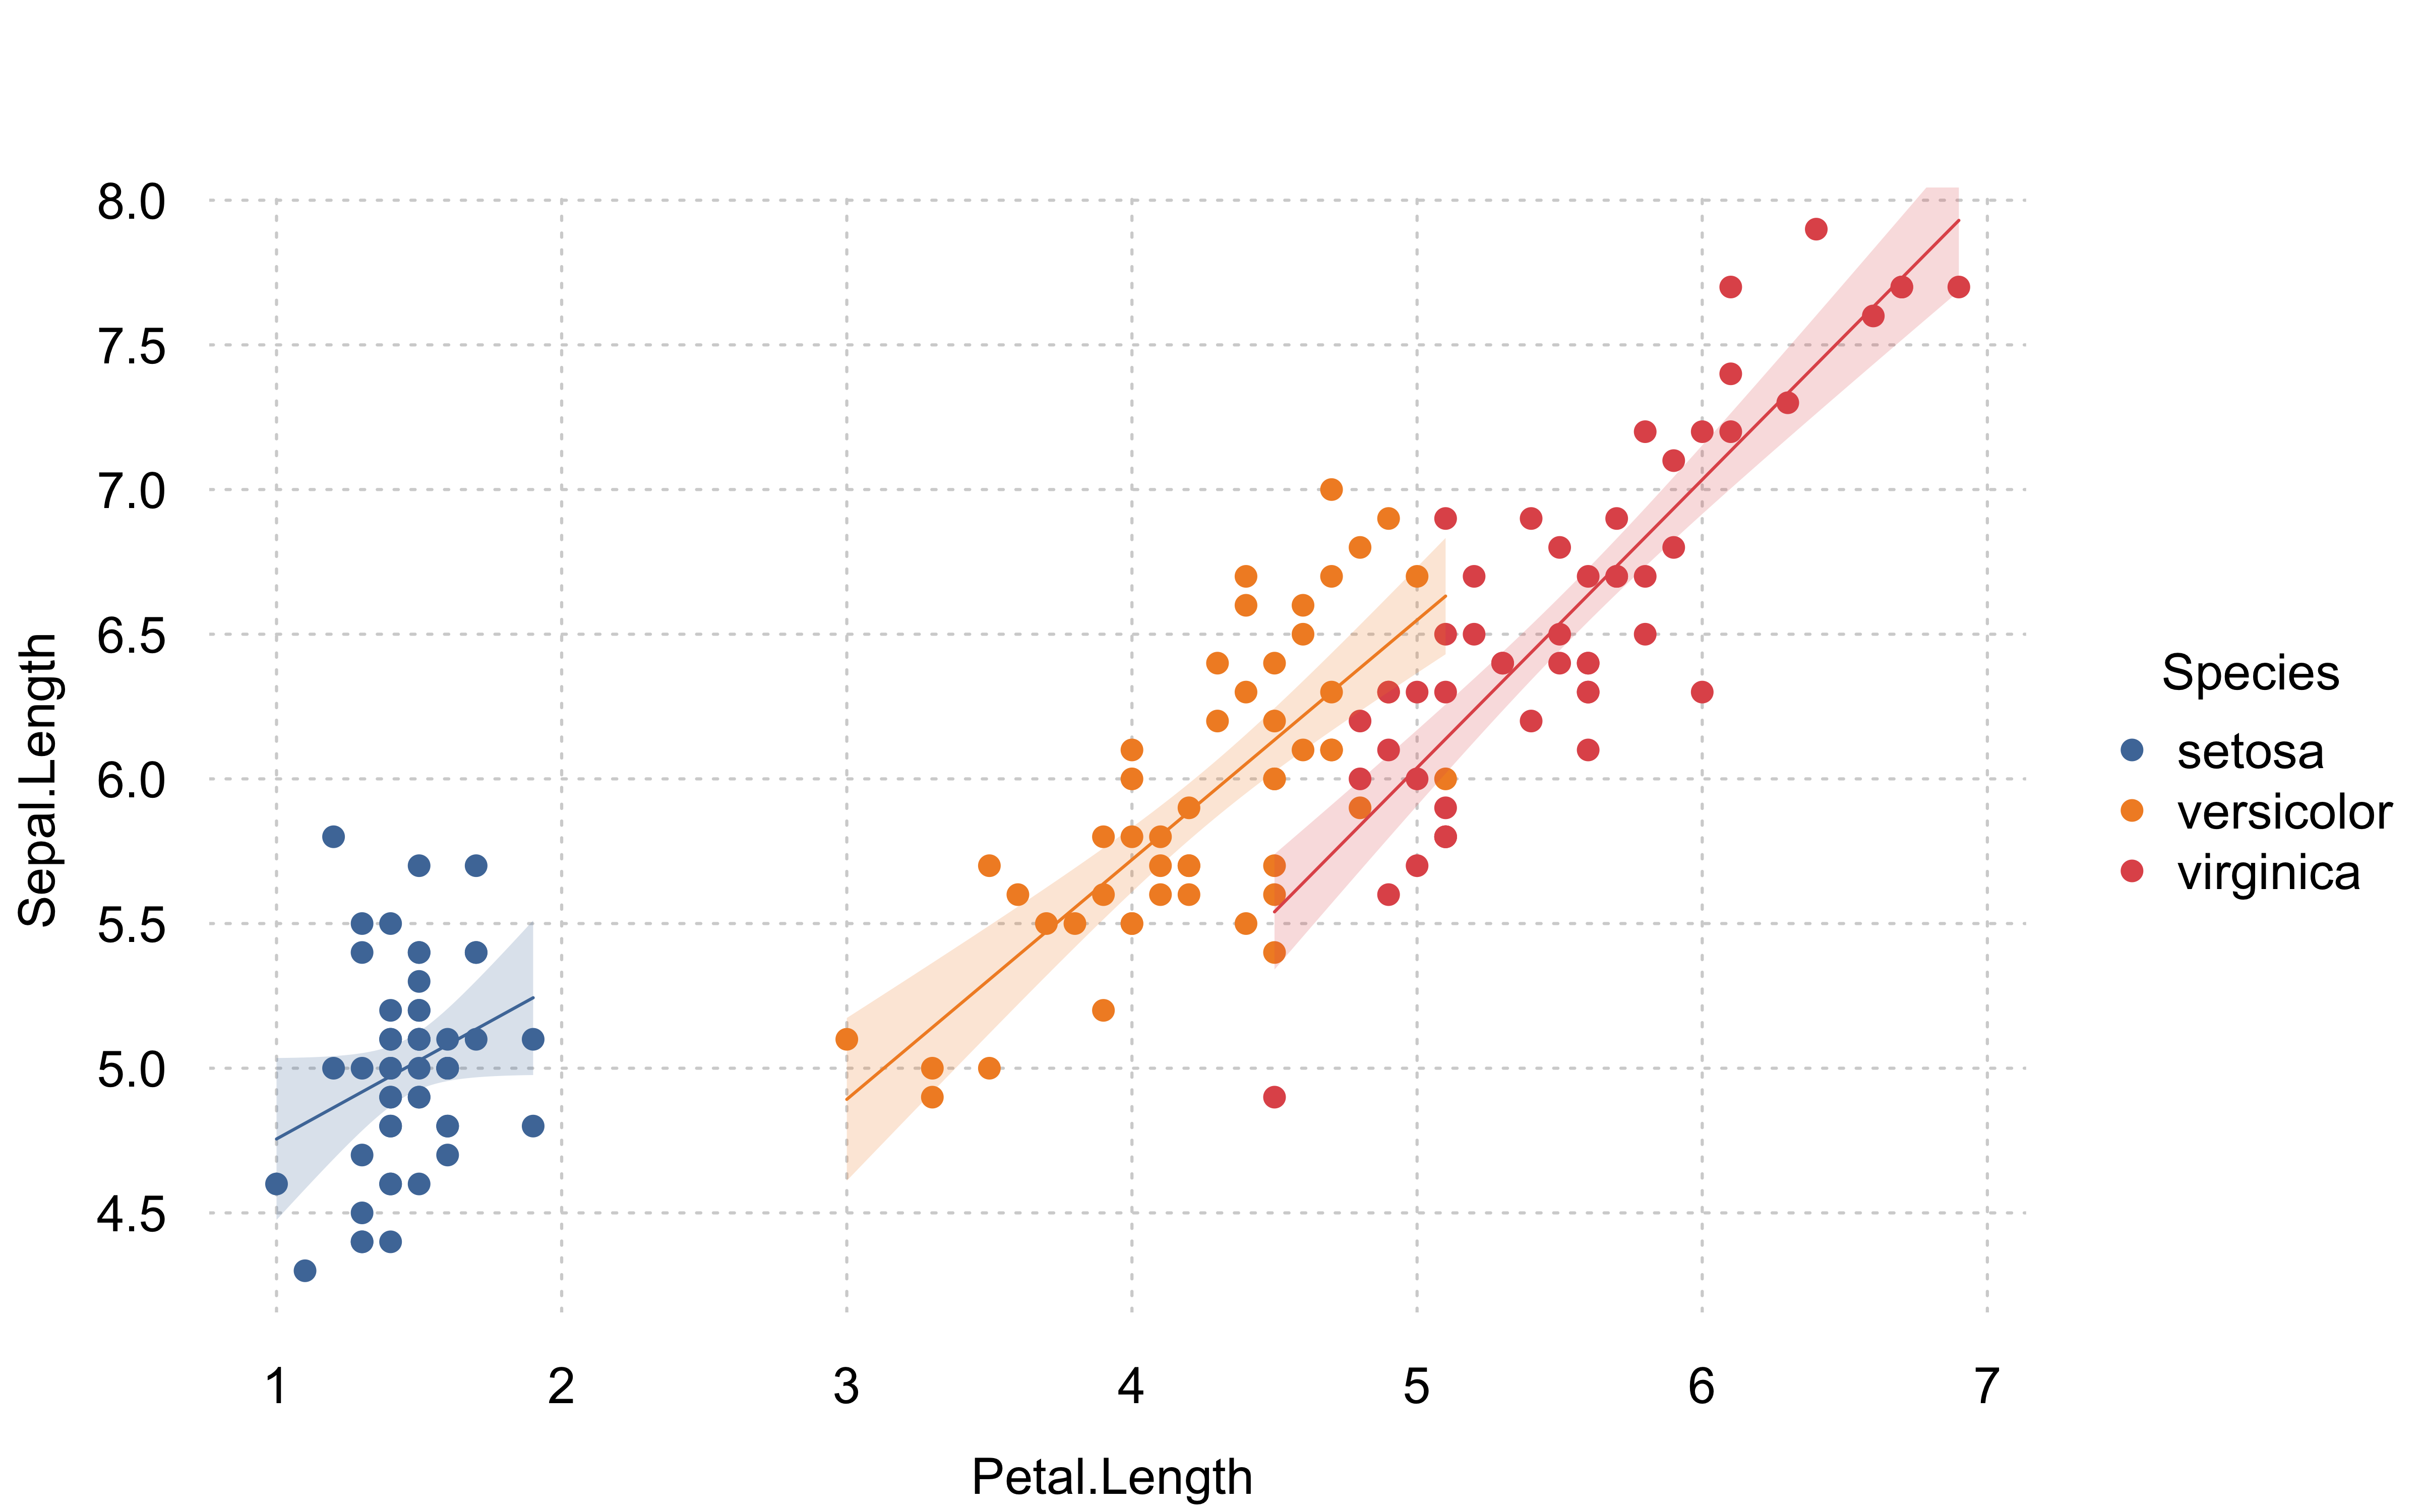
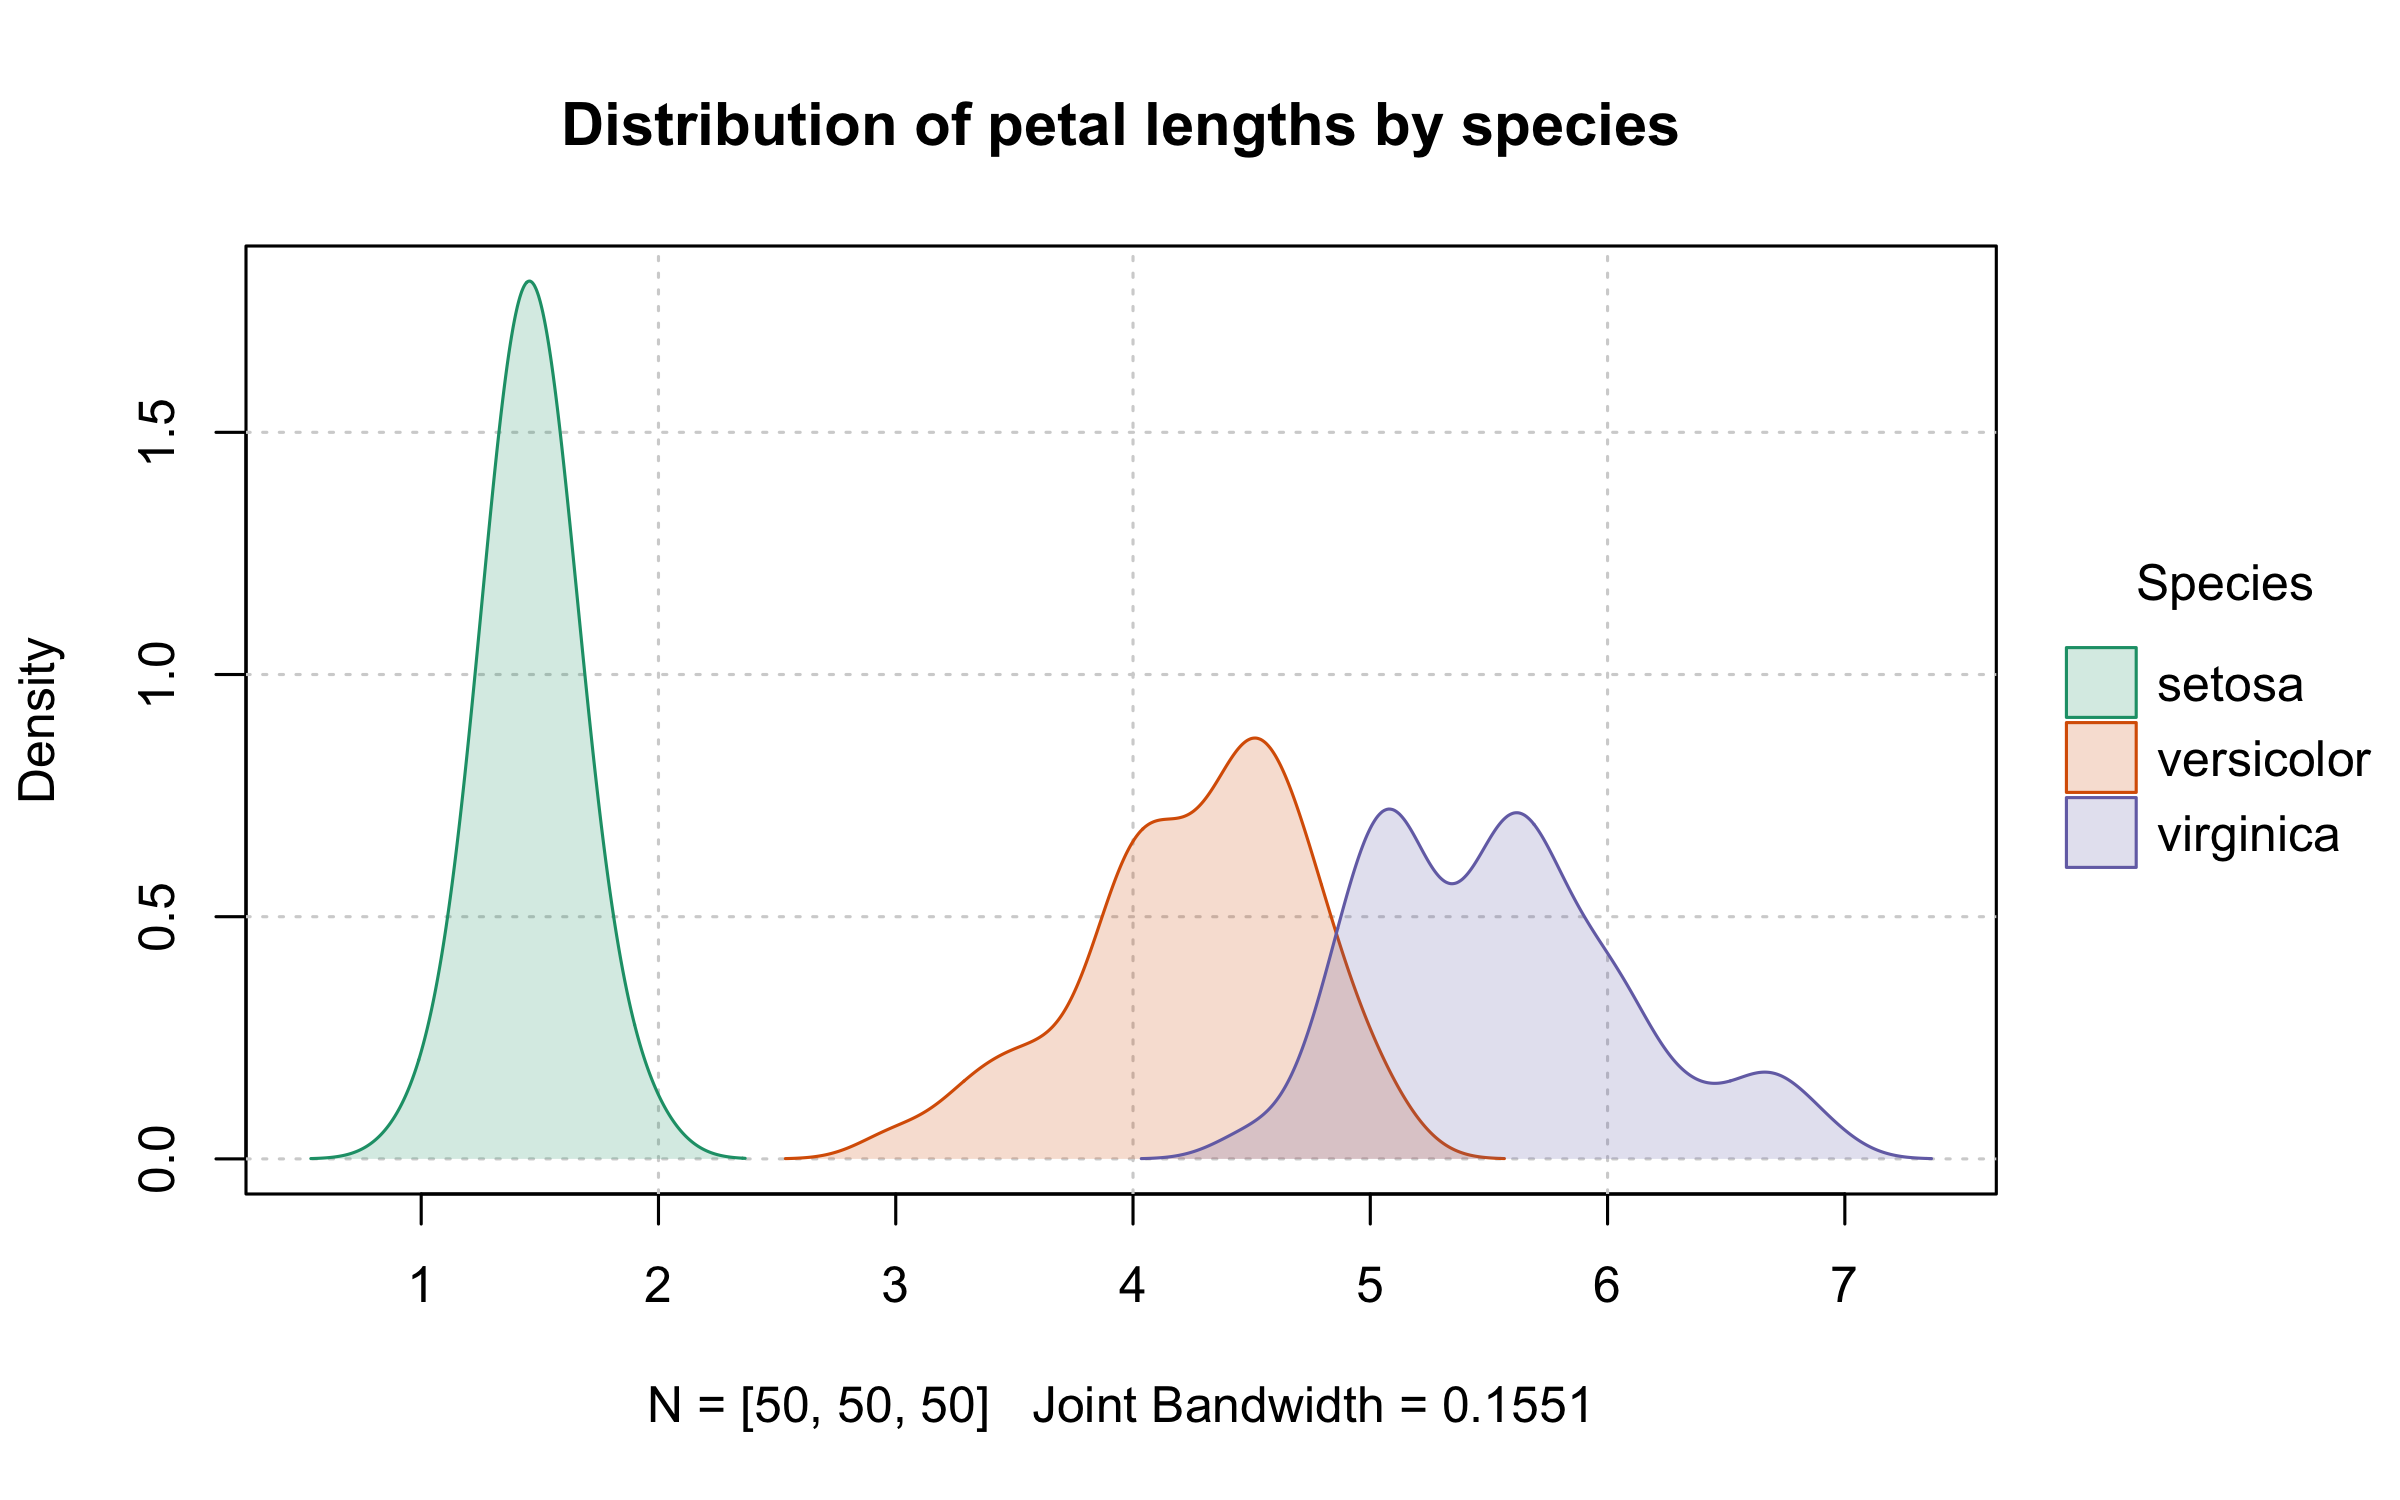
Themes are persistent and will be applied to subsequent plots. For example, here is a grouped density plot:
plt(
  ~ Petal.Length | Species,
  data = iris,
  type = "density",
  fill = "by",
  main = "Distribution of petal lengths",
  sub = "Grouped by species"
)
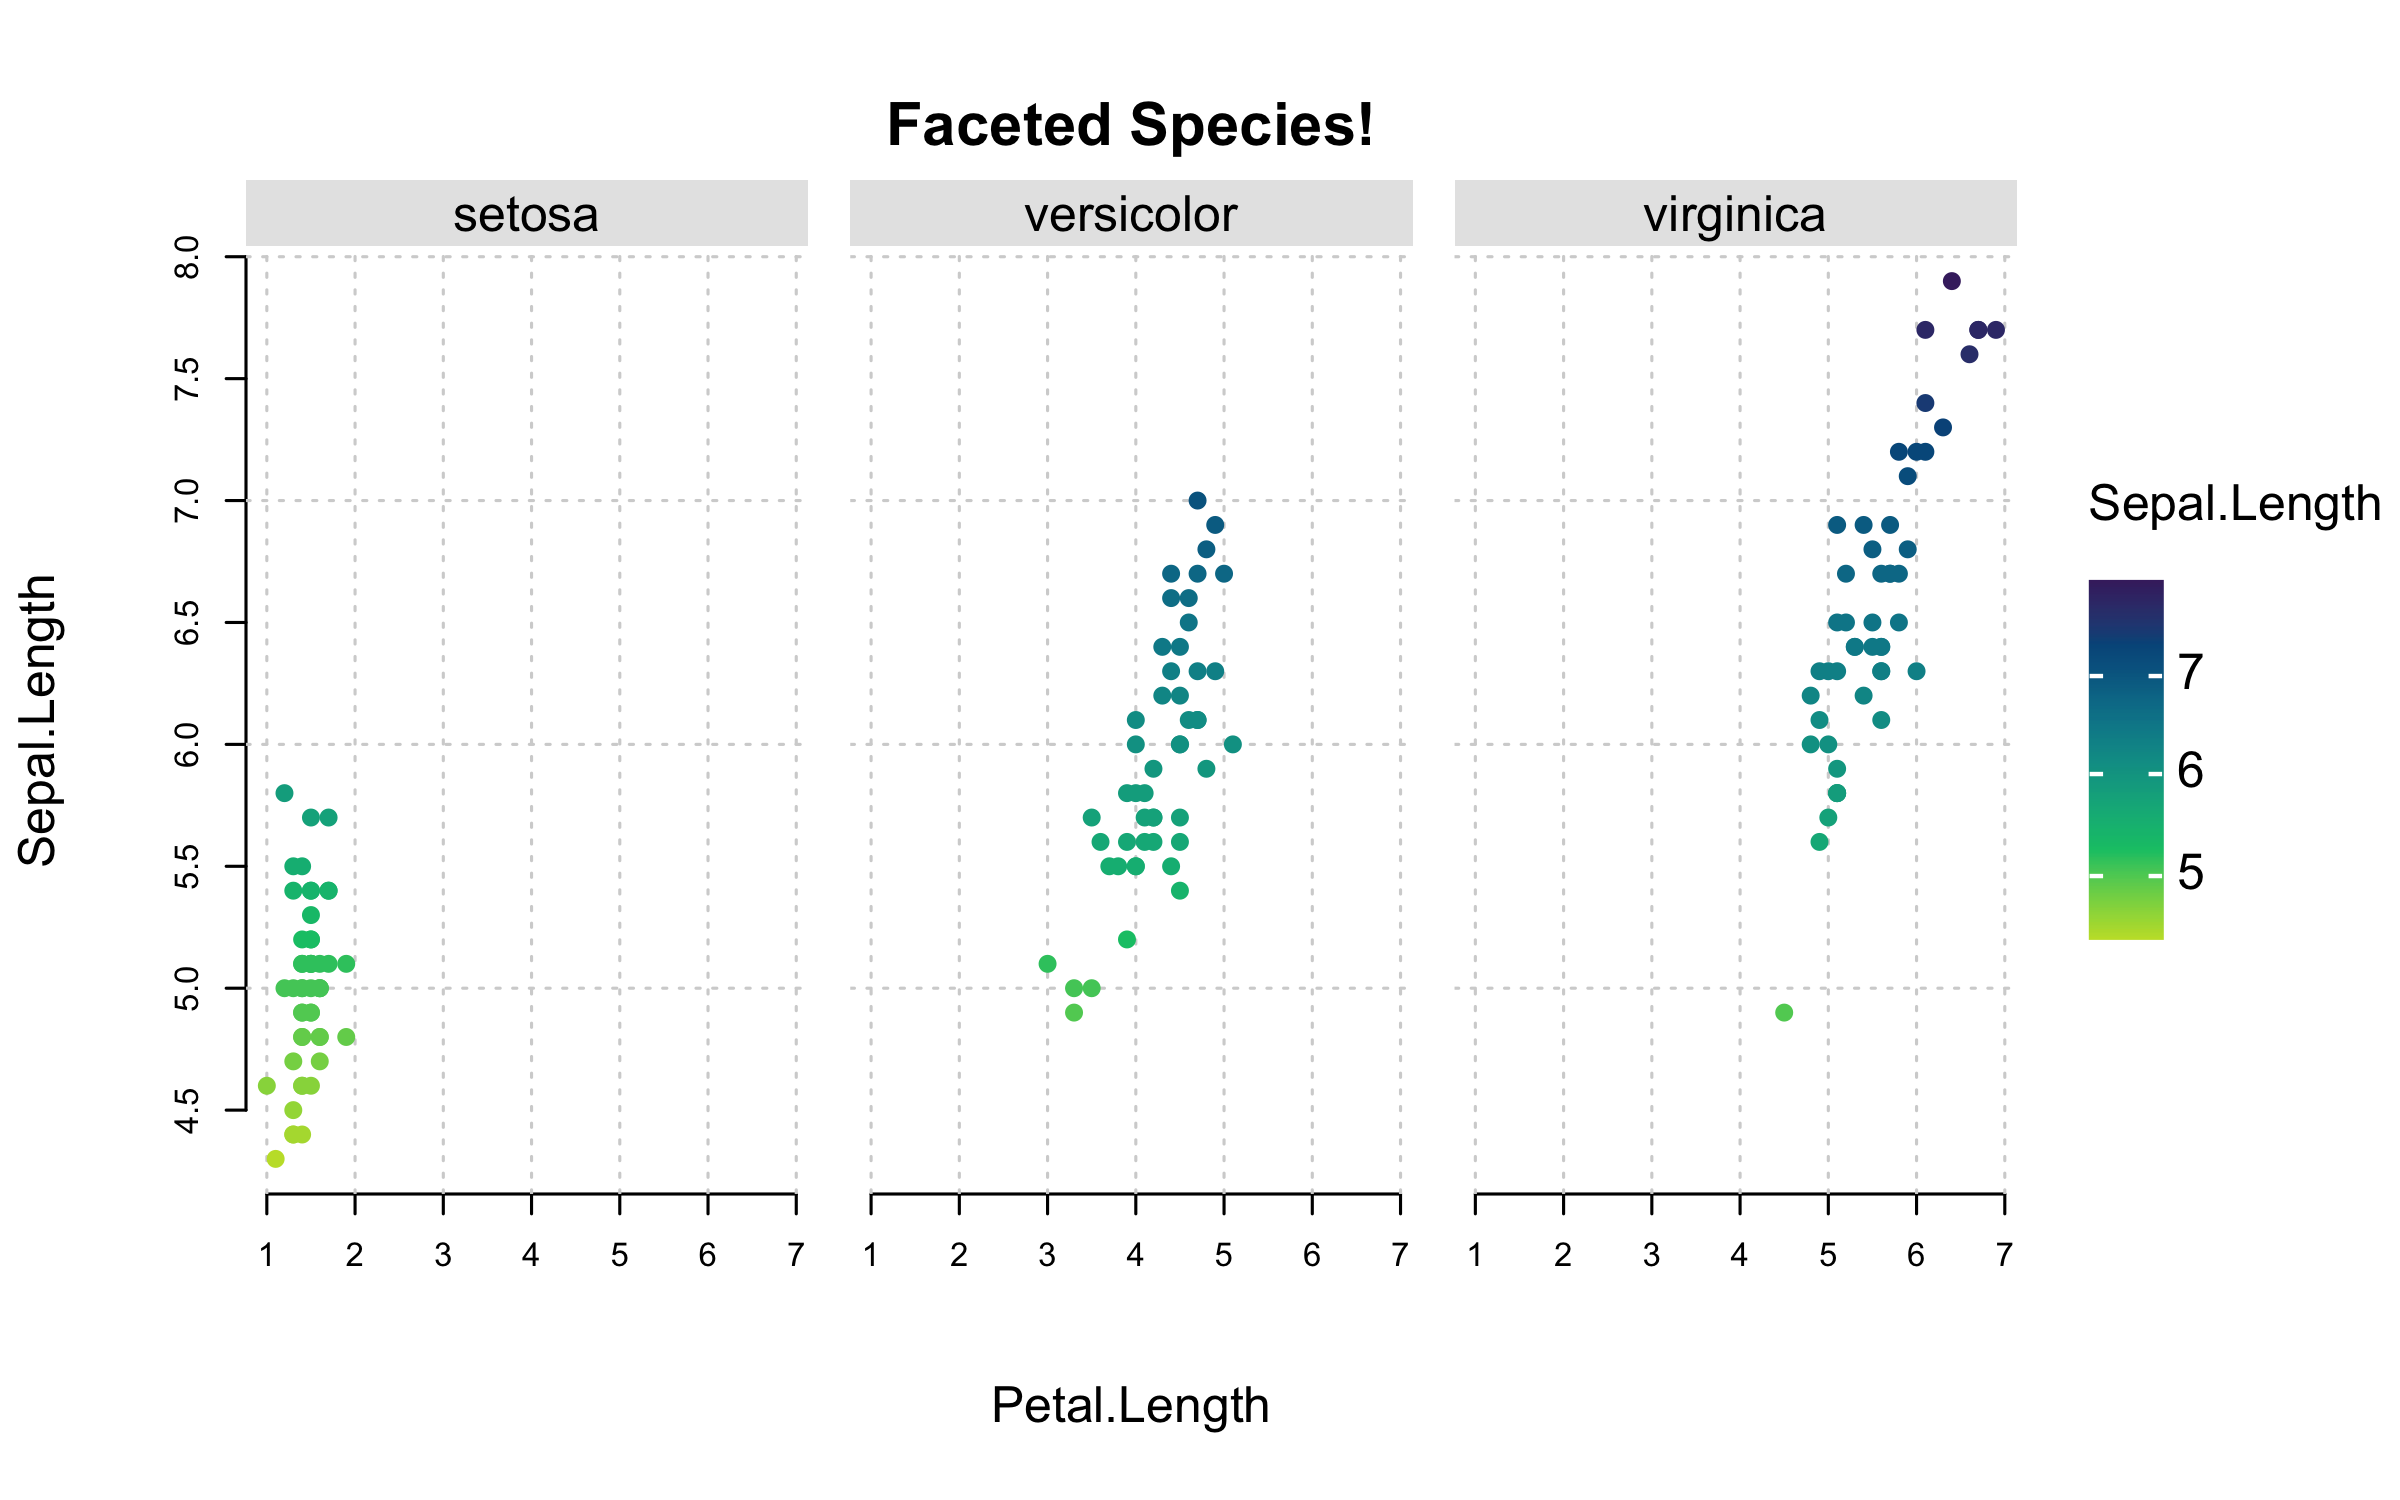
Grouped scatterplot with (continuous) gradient legend, combined with facet layout:
plt(
  Sepal.Length ~ Petal.Length | Sepal.Length, data = iris,
  facet = ~Species, pch = 19,
  main = "Faceted flowers", sub = "Brought to you by tinyplot"
)
# reset the theme
tinytheme()
Hopefully, these have been enough to pique your interest. Head over to the intro tutorial for many more examples, including model-based and custom plot types.
You could make a strong case that ggplot2, in particular, is the most influential graphics library of the last two decades, across any programming language. Both ggplot2 and lattice are built on top of the lower-level grid package, which was incorporated into the base R distribution way back in R 2.0.0.↩︎
Just type demo(graphics)
or demo(persp) into your R console to get an idea. Or, take
a look at these
two
excellent tutorials.↩︎