The R package, blindspiker, was initially developed for
the Internal Dosimetry program at the Savannah River Site, based on an R
script, “SRS Blind Spikes-4.R”, written by Tom Labone.
The first step in using the package is to load your
data. This is made easy with the get_data
function. This function reads in data directly from .csv
files. See the help for get_data (?get_data)
for the necessary columns.
To summarize the spike values provided to the laboratory,
table_spike summarizes all individual spike
values and
spike_combos provides any combinations
of spike values in individual samples that the user chooses to have
tallied.
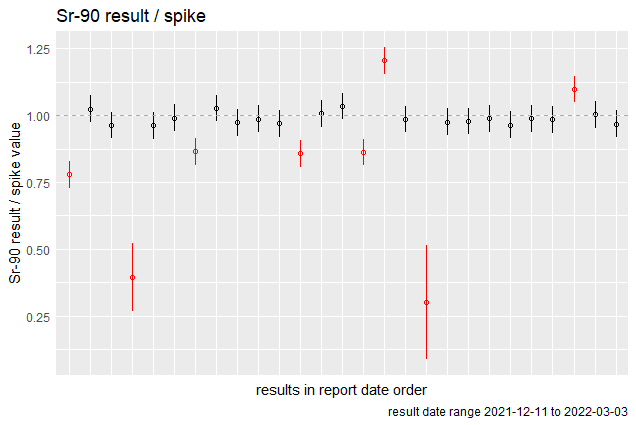
plot_run provides run charts with the
option of plotting in analysis units or by a ratio of the laboratory
results to the blind spike values. Both versions show uncertainty ranges
of the results. Uncertainty bars are shown on the laboratory results and
the ratios. When there is no overlap with the spike values, the
laboratory result is either a false positive or a false negative. False
positives are excluded from the ratio version when there is no spike
value to avoid division by zero.
table_false provides confidence intervals on
error rates for all laboratory results.
plot_tat plots the laboratory turnaround
time for each spike sample.
plot_qq provides quantile-quantile
plots of the results. Random errors are expected to fluctuate
in a normally distributed pattern. When the QQ plot shows a deviation
from normal, further investigation in the underlying process may be
needed.