
Implementation of Sparse-group SLOPE (SGS), a sparse-group penalisation regression approach. SGS performs adaptive bi-level selection, controlling the FDR under orthogonal designs. The package also has an implementation of Group SLOPE (gSLOPE), which performs group selection and controls the group FDR under orthogonal designs, as well as group-based OSCAR models. Linear and logistic regression are supported, both with dense and sparse matrix implementations. Both models have strong screening rules to improve computational speed. Cross-validation functionality is also supported. Both models are implemented using adaptive three operator splitting (ATOS) and the package also contains a general implementation of ATOS.
A detailed description of SGS can be found in Feser, F., Evangelou, M. (2023). “Sparse-group SLOPE: adaptive bi-level selection with FDR-control”.
gSLOPE was proposed in Brzyski, D., Gossmann, A., Su, W., Bodgan, M. (2019). “Group SLOPE – Adaptive Selection of Groups of Predictors”.
The strong screening rules are described in Feser, F., Evangelou, M. (2024). “Strong screening rules for group-based SLOPE models”.
You can install the current stable release from CRAN with
install.packages("sgs")Your R configuration must allow for a working Rcpp. To install a develop the development version from GitHub run
library(devtools)
install_github("ff1201/sgs")The code for fitting a basic SGS model is:
library(sgs)
groups = c(rep(1:20, each=3),
           rep(21:40, each=4),
           rep(41:60, each=5),
           rep(61:80, each=6),
           rep(81:100, each=7))

data = gen_toy_data(p=500, n=400, groups = groups, seed_id=3)

model = fit_sgs(X = data$X, y = data$y, groups = groups, vFDR=0.1, gFDR=0.1)
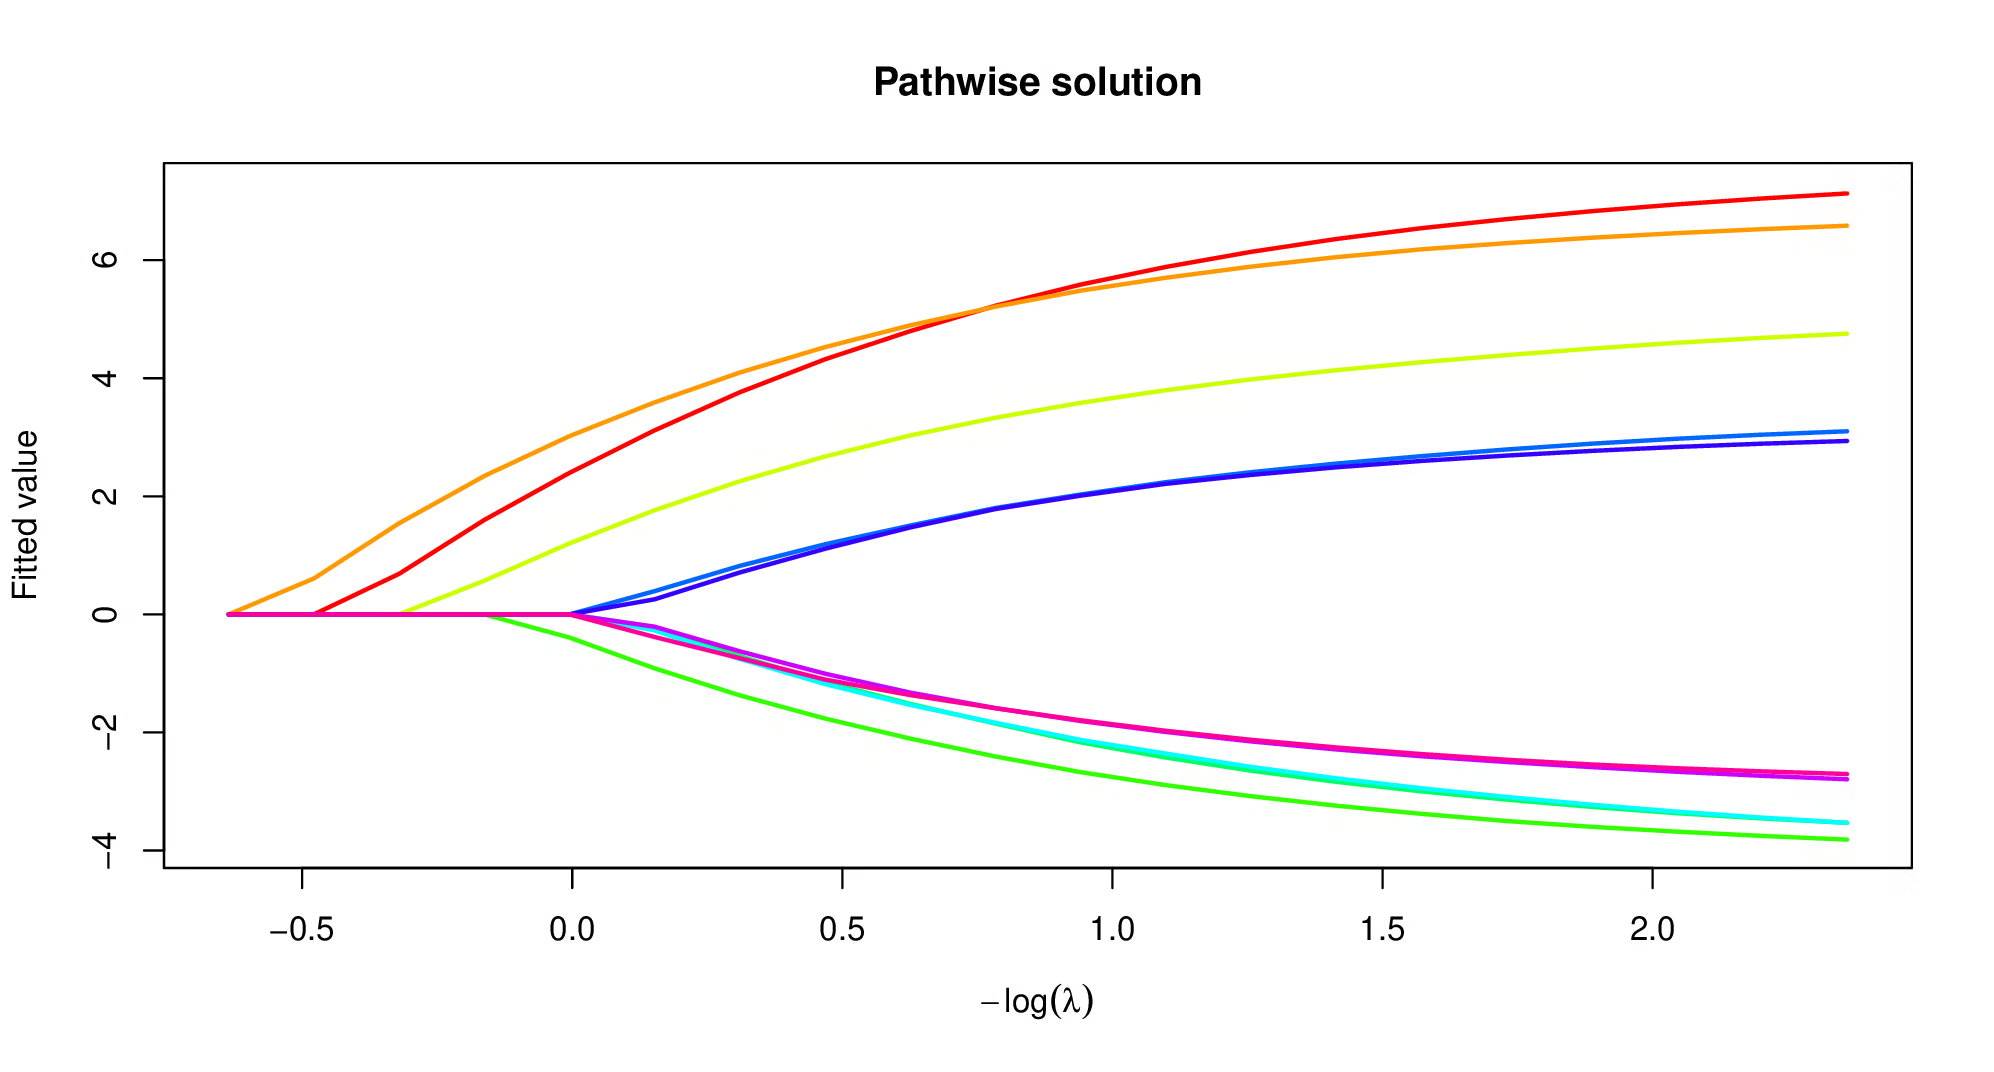
plot(model)
where X is the input matrix, y the response
vector, groups a vector containing indices for the groups
of the predictors, and vFDR and gFDR are the
the target variable/group false discovery rates.
For gSLOPE, run:
library(sgs)
groups = c(rep(1:20, each=3),
           rep(21:40, each=4),
           rep(41:60, each=5),
           rep(61:80, each=6),
           rep(81:100, each=7))

data = gen_toy_data(p=500, n=400, groups = groups, seed_id=3)

model = fit_gslope(X = data$X, y = data$y, groups = groups, gFDR=0.1)
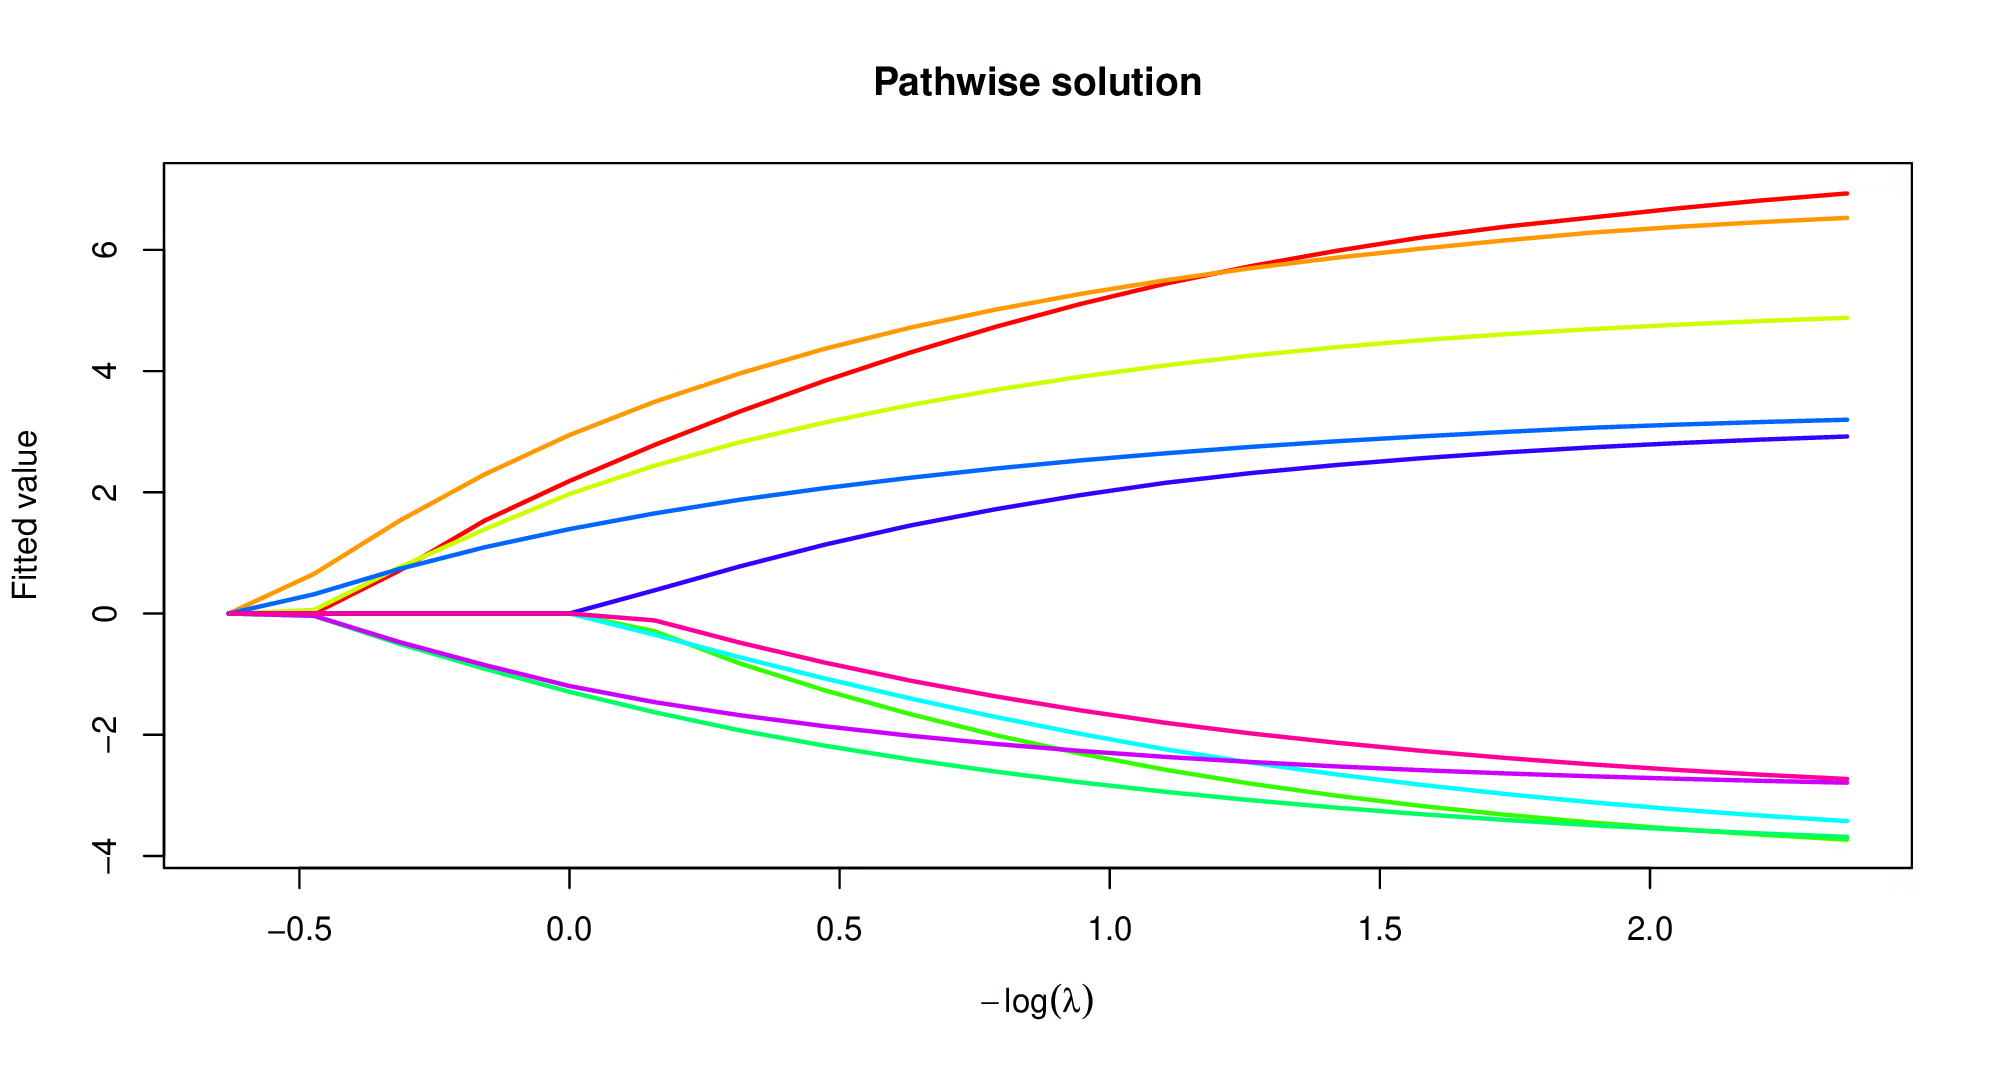
plot(model)