
Vignettes
Guides
Case studies
snakeplot draws serpentine plots of long ordered data: a
questionnaire item by item, experience-sampling ratings day by day,
categorical state sequences, timelines of phases, and time-stamped daily
activity. The ordered axis is folded into horizontal bands joined by
U-turn arcs, so a long record fits one panel with its order kept and
neighbouring segments can be compared directly. A survey snake plot
shows the response distribution of each item as ticks, dots or stacked
bars, with the item mean, an optional median and the correlation between
adjacent items; an activity snake plot gives each study day its own band
and places each prompt at its time of day.
All plots use base R graphics, and the package has no dependencies beyond those that ship with R.
An ordered axis, whether of items, days or positions in a sequence,
is cut into bands of equal length that share one scale. With
flow = "snake" the reading direction alternates from band
to band, as in boustrophedon writing, so the end of each band is
adjacent to the start of the next. With flow = "natural"
every band reads in the same direction, so a position within a band,
such as a time of day, has the same horizontal location on every band.
The first arrangement keeps the sequence continuous across the U-turns;
the second aligns a shared axis down the page. Each band is a unit of
comparison (an item, a day, a segment of a sequence), and the band
shading, the U-turn arcs and the legend encode summaries of the units
they join.
install.packages("snakeplot")

# development version
install.packages("remotes")
remotes::install_github("mohsaqr/snakeplot")The package includes three datasets from a 14-day experience sampling
study of university students (Neubauer & Schmiedek, 2024), rescaled
to a 1–5 scale: ema_emotions (280 students by 10 emotion
items, each a student’s mean rating over the study),
student_survey (the same students by 34 items in four
constructs) and ema_beeps (11,474 answered prompts from 321
students, with day, time and two ratings).
Each item is a band. The widths of the colored zones are the shares of the response levels, the ticks are the individual responses, and the diamond marks the item mean. Sorting by the mean orders the items from the least to the most endorsed.
library(snakeplot)

survey_snake(ema_emotions, sort_by = "mean",
             colors = snake_palette("ocean", n = 5),
             level_labels = c("1" = "Not at all", "2" = "Slightly",
                              "3" = "Moderate", "4" = "Quite",
                              "5" = "Extremely"))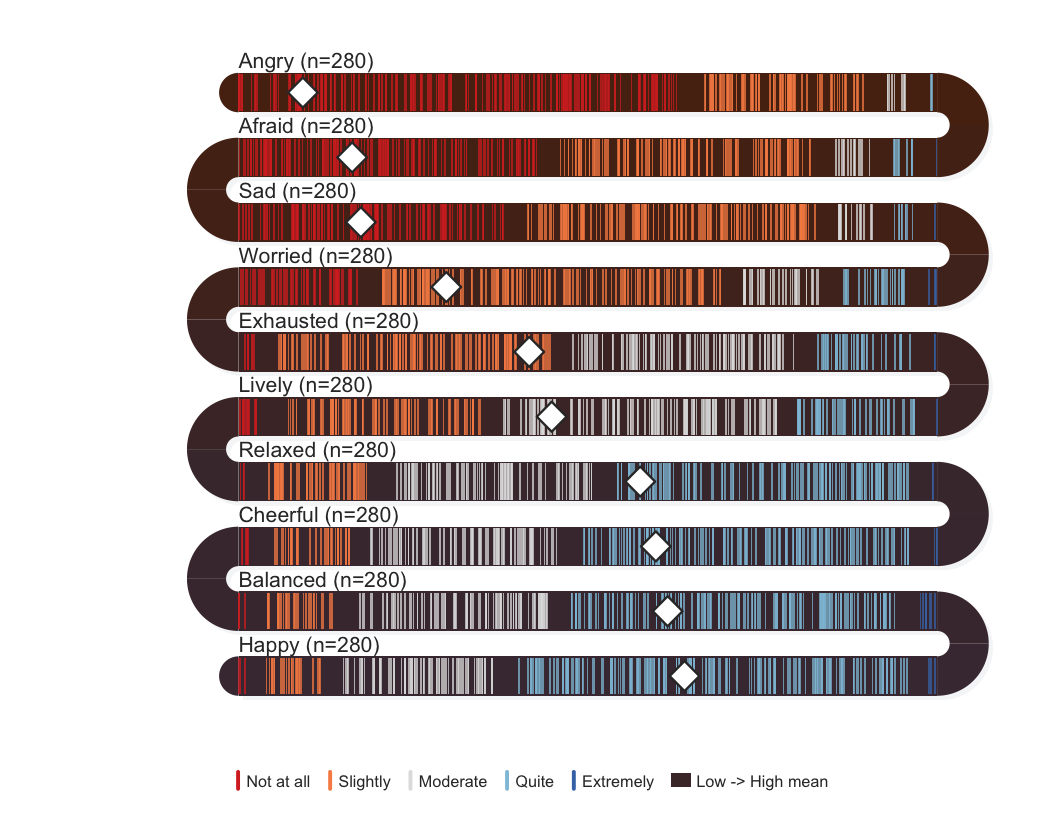
plot of chunk survey
With var and day, beep-level data are drawn
as one band per study day for one rating; timestamp places
each answered prompt at its time of day.
survey_snake(ema_beeps, var = "happy", day = "day",
             timestamp = "start_time",
             colors = snake_palette("ocean", n = 5),
             title = "Happiness, by time of day")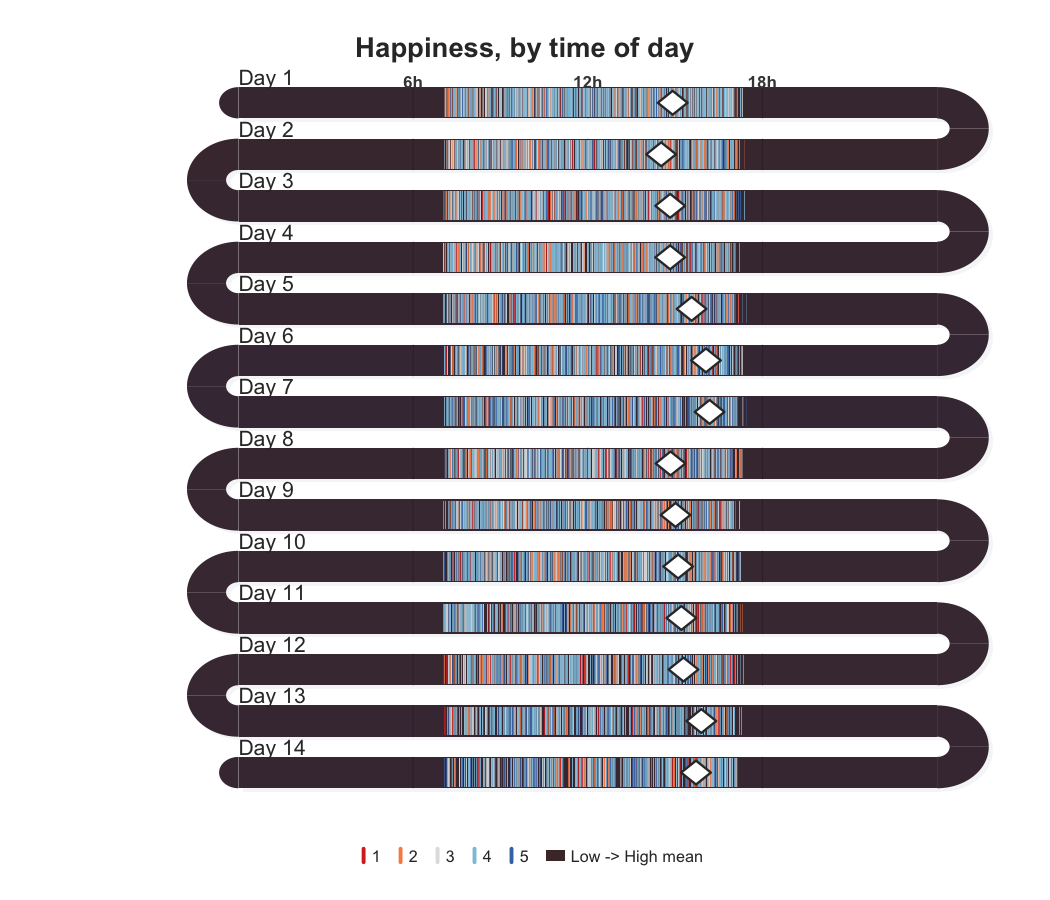
plot of chunk daily
sequence_snake() folds an ordered categorical sequence
into bands of blocks colored by state; timeline_snake()
draws phases with start and end dates as monthly blocks with labelled
transitions.
career <- data.frame(
  role  = c("Intern", "Junior developer", "Developer",
            "Senior developer", "Lead", "Architect"),
  start = c("2015-01", "2015-07", "2017-01", "2019-07", "2022-07",
            "2024-01"),
  end   = c("2015-06", "2016-12", "2019-06", "2022-06", "2023-12",
            "2024-12")
)
timeline_snake(career)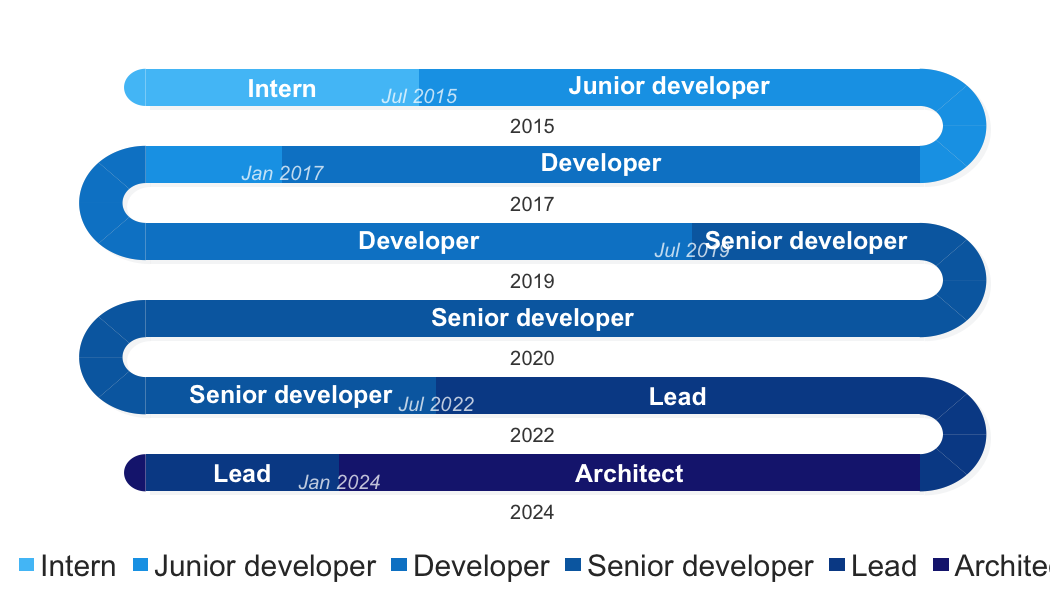
plot of chunk timeline
snakeplot is written by Mohammed Saqr and Sonsoles López-Pernas. Mohammed Saqr
maintains the package. Questions and bug reports can be submitted
through the repository issue
tracker. The package citation is available through
citation("snakeplot").
The bundled data are derived from Neubauer, A. B., & Schmiedek, F. (2024). Approaching academic adjustment on multiple time scales. Zeitschrift für Erziehungswissenschaft, 27(1), 147–168. https://doi.org/10.1007/s11618-023-01182-8 (data, codebook, CC-BY 4.0).